Introduction
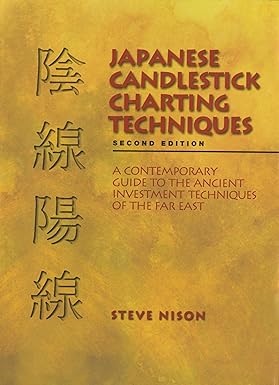
Ever wondered how traders manage to read the market like a book? The answer often lies in the visual language of charts—specifically, candlestick charts. In this blog post, we’re peeling back the layers of one of the most influential books in trading history: Japanese Candlestick Charting Techniques by Steve Nison.
This book isn’t just another technical manual. It’s a revolution in how traders view price action. Whether you’re a beginner or a seasoned trader, Nison’s work will sharpen your chart-reading skills and give you a psychological edge that most overlook.
📚 Affiliate Disclosure: This post contains an affiliate link. If you decide to purchase through it, I may earn a small commission at no extra cost to you. Here’s the link: Grab your copy of Japanese Candlestick Charting Techniques
🕯️ What Are Japanese Candlestick Charts?
Before candlesticks went mainstream in the West, they were used by Japanese rice traders over 300 years ago. These charts display four essential data points for a given time period:
- Open
- Close
- High
- Low
Unlike the bar or line charts, candlestick charts provide visual clues about market psychology, momentum, and potential reversals—all with a single glance.
Steve Nison was instrumental in bringing this method to the Western world. His book, Japanese Candlestick Charting Techniques, translated centuries of Eastern wisdom into actionable strategies for today’s traders.
🧠 Why This Book Matters
Japanese Candlestick Charting Techniques isn’t just about pretty candles. It’s about understanding the emotion behind each price movement.
Here’s why this book is a game-changer:
- Introduces over 50 powerful candlestick patterns
- Combines candlestick analysis with traditional Western technical indicators
- Teaches traders how to predict reversals and continuations
- Encourages disciplined thinking and pattern recognition
🔗 Want to see why this book is recommended by top professional traders? Click here to check it out on Amazon
🔍 Key Candlestick Patterns Covered in the Book
Let’s explore some of the most iconic candlestick patterns Steve Nison dives into—and why they matter:
1. Doji
A Doji occurs when the opening and closing prices are virtually equal. It signals indecision in the market and often precedes major reversals.
2. Hammer
Found at the bottom of downtrends, hammers suggest a potential bullish reversal. It’s characterized by a small body and a long lower shadow.
3. Engulfing Pattern
This pattern occurs when a small candle is completely “engulfed” by the next one. A bullish engulfing at the bottom of a trend signals buyers stepping in aggressively.
4. Shooting Star
A bearish reversal pattern that appears after an uptrend. It indicates the bulls are losing steam.
These are just the tip of the iceberg. Steve Nison breaks down each one with real chart examples, showing how they function in both isolation and context.
🎯 How This Book Improves Your Trading
Reading this book will transform the way you trade. Here’s how:
✅ Improves Entry and Exit Timing
Rather than relying on lagging indicators, candlestick patterns give you real-time market sentiment.
✅ Boosts Confidence
Knowing how to identify candlestick formations can remove guesswork from your trades.
✅ Works Across All Timeframes
Whether you’re scalping 5-minute charts or analyzing daily trends, candlestick techniques adapt seamlessly.
✅ Complements Other Tools
Steve Nison emphasizes integrating candlesticks with indicators like moving averages, Bollinger Bands, and RSI for powerful confirmation.
📘 Curious how pros use candlesticks to time their entries? Grab the original source from Amazon
📈 Candlesticks + Western Indicators = A Killer Combo
One of the book’s standout qualities is how it harmonizes Eastern candlestick wisdom with Western technical tools. For example:
- Use candlestick reversal patterns with trendlines to confirm breakout or breakdown.
- Pair Doji formations with MACD crossovers for enhanced reliability.
- Validate Bullish Engulfing patterns with volume spikes.
Steve Nison isn’t asking you to abandon your toolkit. He’s showing you how to make it sharper.
🧩 Psychology Behind the Patterns
Each candle tells a story. That’s what sets Nison’s book apart. It’s not about memorizing patterns—it’s about understanding why they work.
A “Hammer” isn’t just a shape; it shows that sellers tried to push prices down, but buyers fought back and closed near the high. That’s a bullish signal rooted in real trader behavior.
Nison’s explanations go beyond the visual pattern to explain the psychology behind it—making the knowledge stick with you longer and making your trades more intentional.
🗂️ Who Should Read This Book?
This isn’t just for chart geeks. This book benefits:
- Day traders looking for precision entry/exit points
- Swing traders aiming to identify key reversals
- Long-term investors who want better buy-the-dip signals
- Beginners eager to learn price action basics
- Experienced traders wanting to refine their edge
If you rely on charts in any capacity, Japanese Candlestick Charting Techniques deserves a space on your shelf (or Kindle).
📦 Ready to upgrade your technical analysis game? Get the book here on Amazon
💡 Practical Takeaways from the Book
✔ You Don’t Need 100 Patterns—Just the Right Ones
Focus on the highest-probability patterns like Doji, Engulfing, Harami, and Shooting Star.
✔ Confirmation Is Key
Never trade solely on a candlestick signal. Always wait for confirmation from volume, trendlines, or momentum indicators.
✔ Context Matters
A pattern in an uptrend has a different implication than one in a downtrend. Always read the bigger picture.
✔ Emotions Leave Footprints
Candlestick charts reveal greed, fear, hesitation, and momentum. Learn to read those footprints.
📚 How This Book Differs From Others
Many technical books feel like reading a dictionary—dry, rigid, and overwhelming. Nison’s writing, on the other hand, is clear, structured, and example-rich.
Here’s how it stands out:
- Over 400+ chart examples
- Real-world case studies
- Glossary and cheat sheets
- Bonus content on risk management and trading discipline
It’s one of the few trading books that feel equally helpful the first time you read it and the tenth.
🎯 Don’t miss this classic. Order your copy on Amazon today
🧪 My Experience Using Nison’s Methods
When I first applied candlestick techniques, I was skeptical. But after identifying a Bullish Harami on a major support level, I entered a swing trade and hit my profit target within days. The pattern worked—not because it was magic, but because I finally understood what the market was feeling.
Once you can see market emotion on a chart, you’ll never go back.
💬 What Traders Are Saying
“This book gave me the missing piece in my trading strategy.” — ⭐⭐⭐⭐⭐
“Steve Nison made charts make sense. A must-read!” — ⭐⭐⭐⭐⭐
“I stopped overtrading once I learned to wait for real patterns.” — ⭐⭐⭐⭐⭐
This isn’t just a book. It’s a mentor on your shelf.
🚀 Final Thoughts: Is It Worth It?
In short: Yes. Absolutely. Without hesitation.
Steve Nison’s Japanese Candlestick Charting Techniques is more than a book—it’s a foundational resource for anyone serious about trading.
If you’re tired of guessing, second-guessing, or being too late to act, this book can revolutionize your trading.
🔗 Ready to see why this book changed how the world views technical analysis? Get your copy on Amazon now
📌 Before You Go…
Want more book reviews, trading strategies, and visual breakdowns?
📥 Bookmark our hub: BookBriefsHub — where trading knowledge meets clarity.
Related Posts You Might Like:
- Master the Market with Scalping: Top 5 Trading Strategies from Andrew C. Ellis
- High Probability Trading Strategies by Robert C. Miner
- Way of the Turtle: The Secret Methods That Turned Ordinary People Into Legendary Traders
Turn Any Idea into Viral,
Jaw-Dropping AI Videos in Seconds!

“Start Your Website Journey Today – Exclusive Hostinger Discounts!”


